wish如何使用ProductBoost产品推广活动业绩页面?
wish如何使用ProductBoost产品推广活动业绩页面?
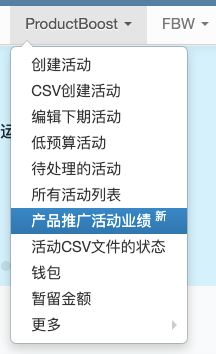
商户可在在商户平台的“ProductBoost > 产品推广活动业绩”页面中查看ProductBoost活动所推广的产品的业绩详情,这将有助于您更好地评估每个产品在不同推广活动中的表现。您可利用此数据信息来对ProductBoost活动做出更好的决策,从而取得更大的成功。
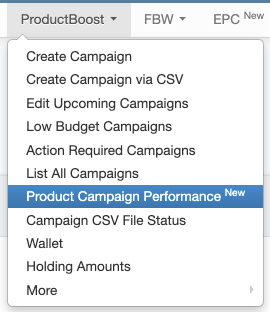
请前往商户平台的“ProductBoost > 产品推广活动业绩”页面,查看每个产品在不同ProductBoost活动中的业绩分析。
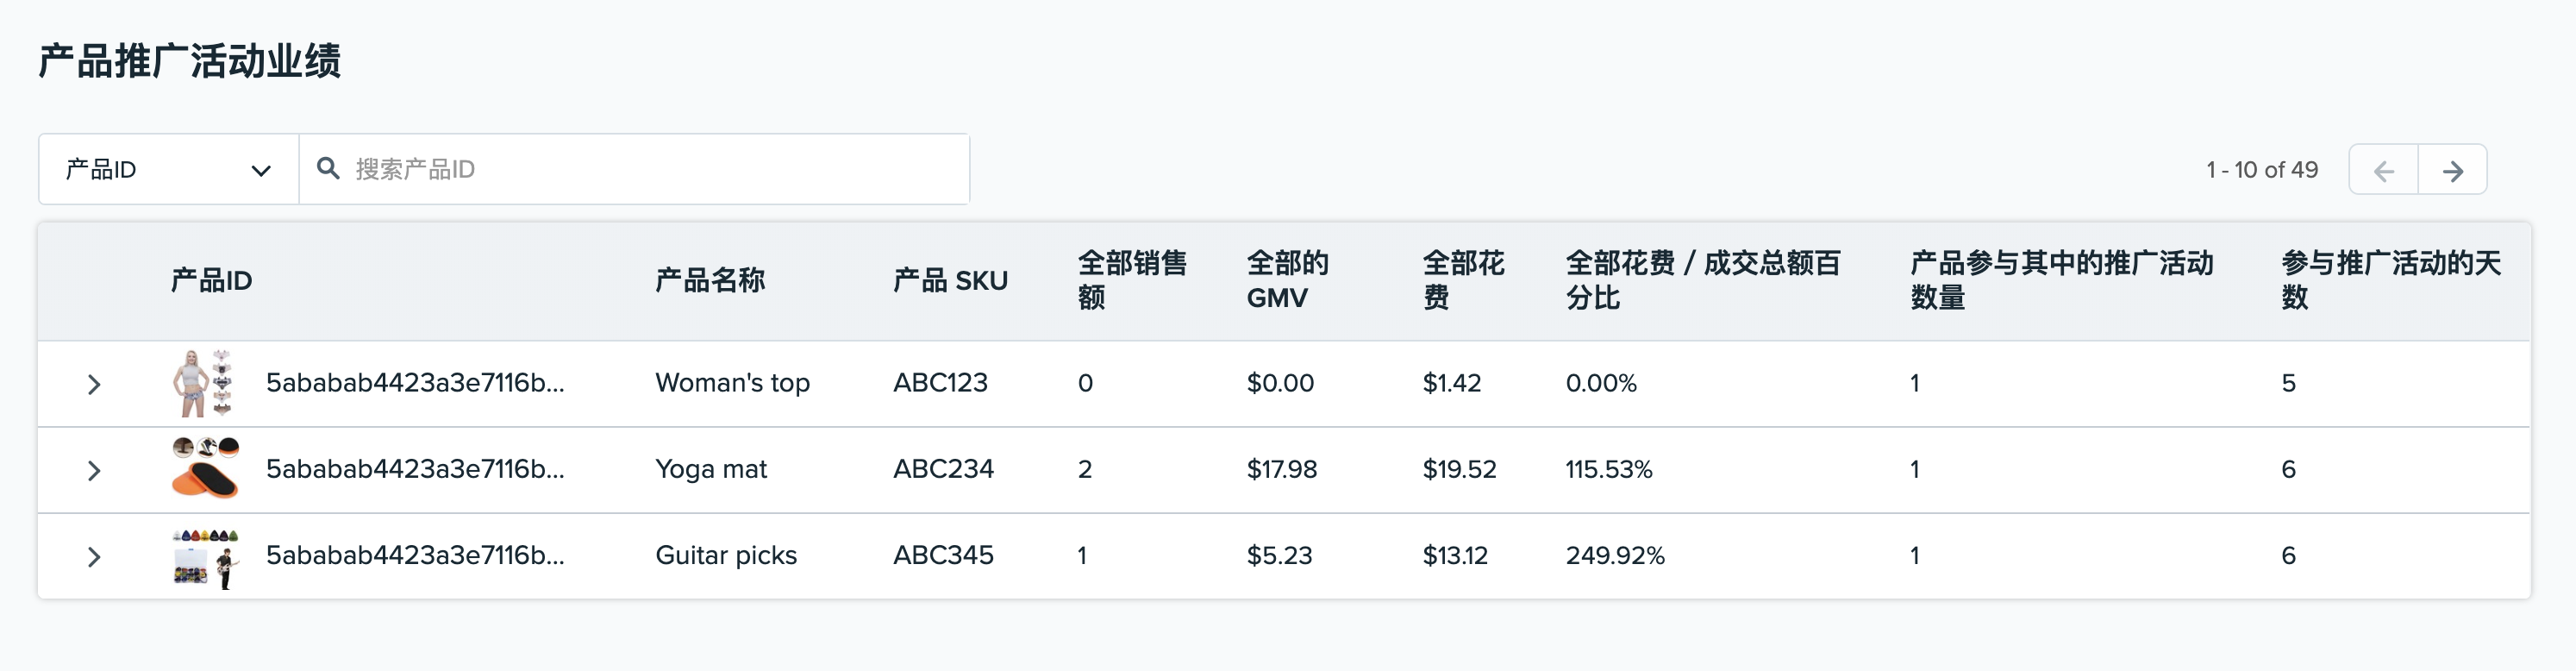
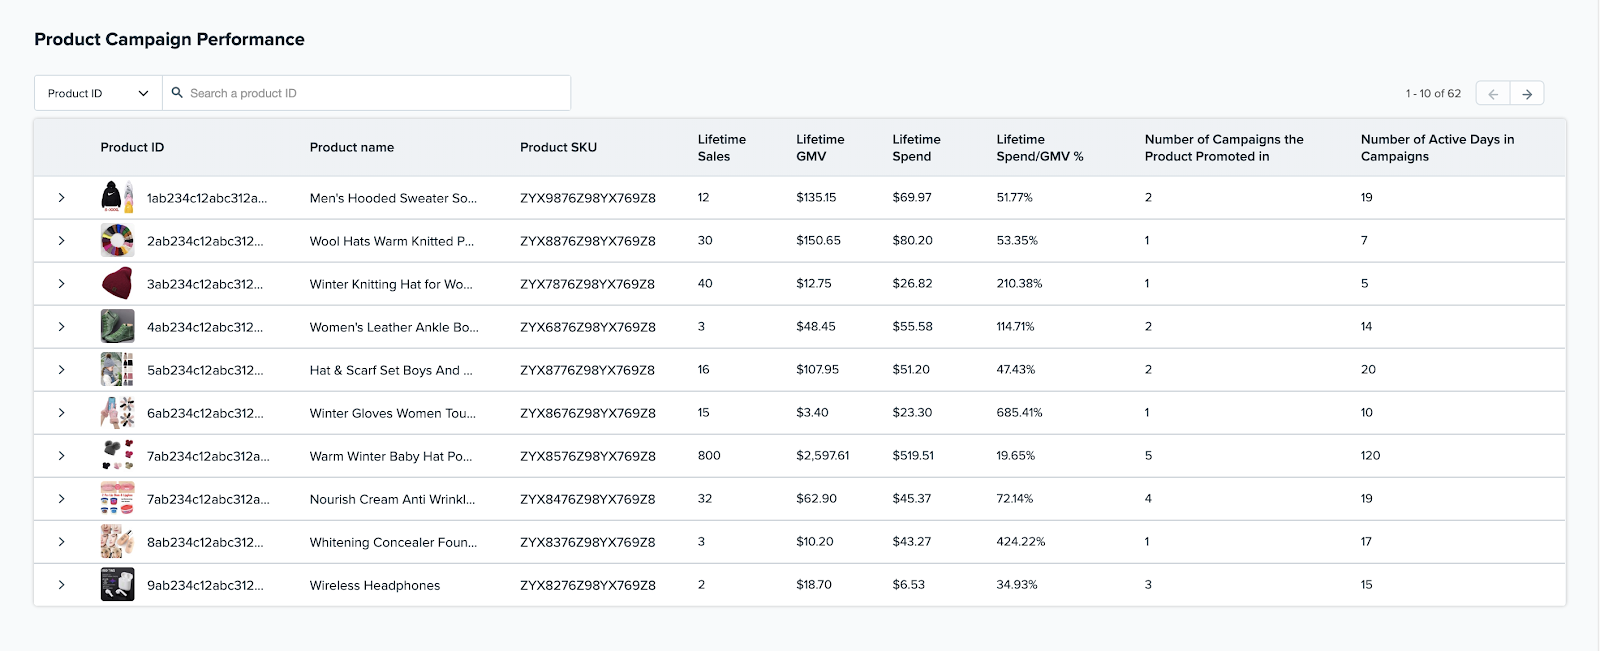
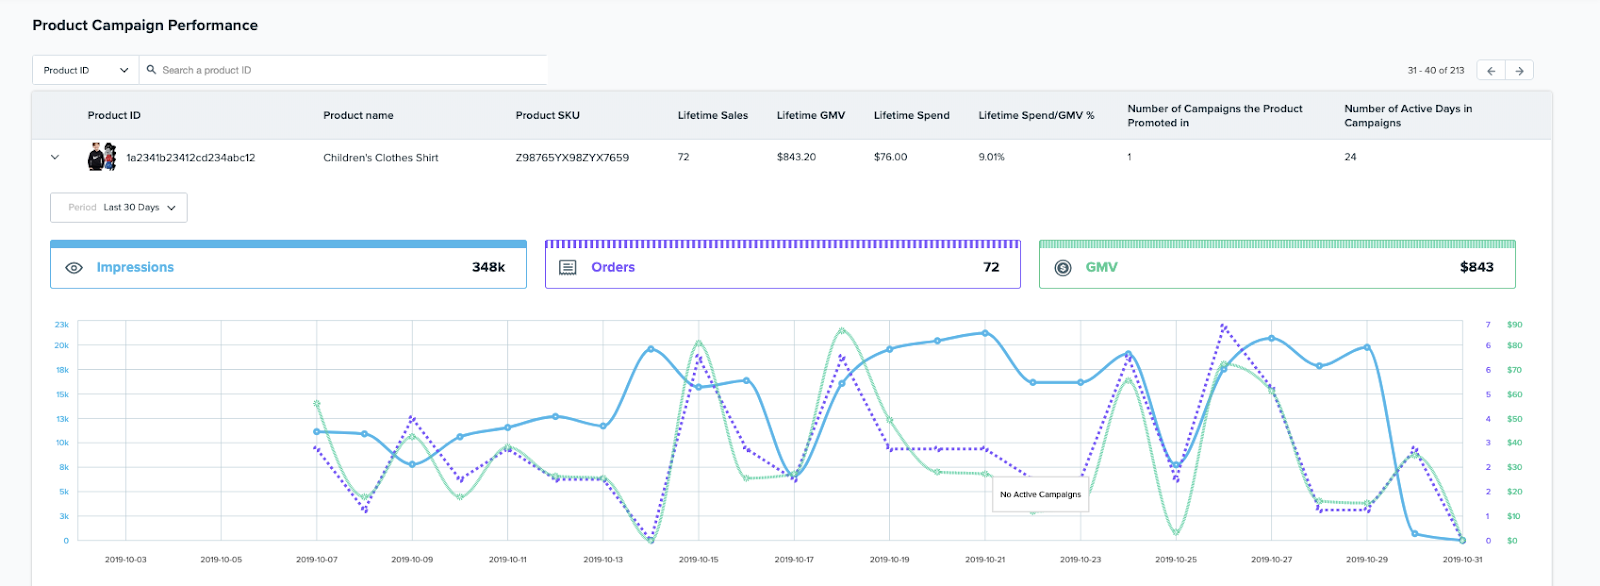
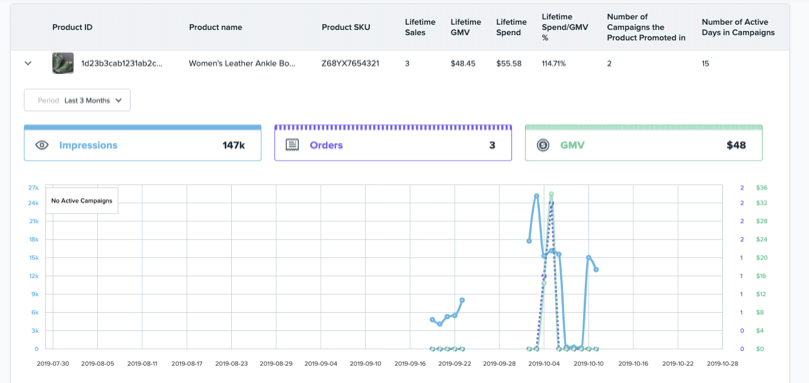
在此“产品推广活动业绩”页面中,您可查看ProductBoost产品的如下信息:全部销售额,全部GMV,全部话费,全部话费 / 成交总额百分比,产品参与其中的推广活动数量,参与推广活动的天数。
请注意,“全部时间”是指产品在ProductBoost活动中活跃的时间。
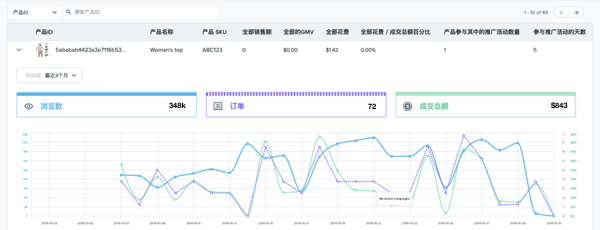
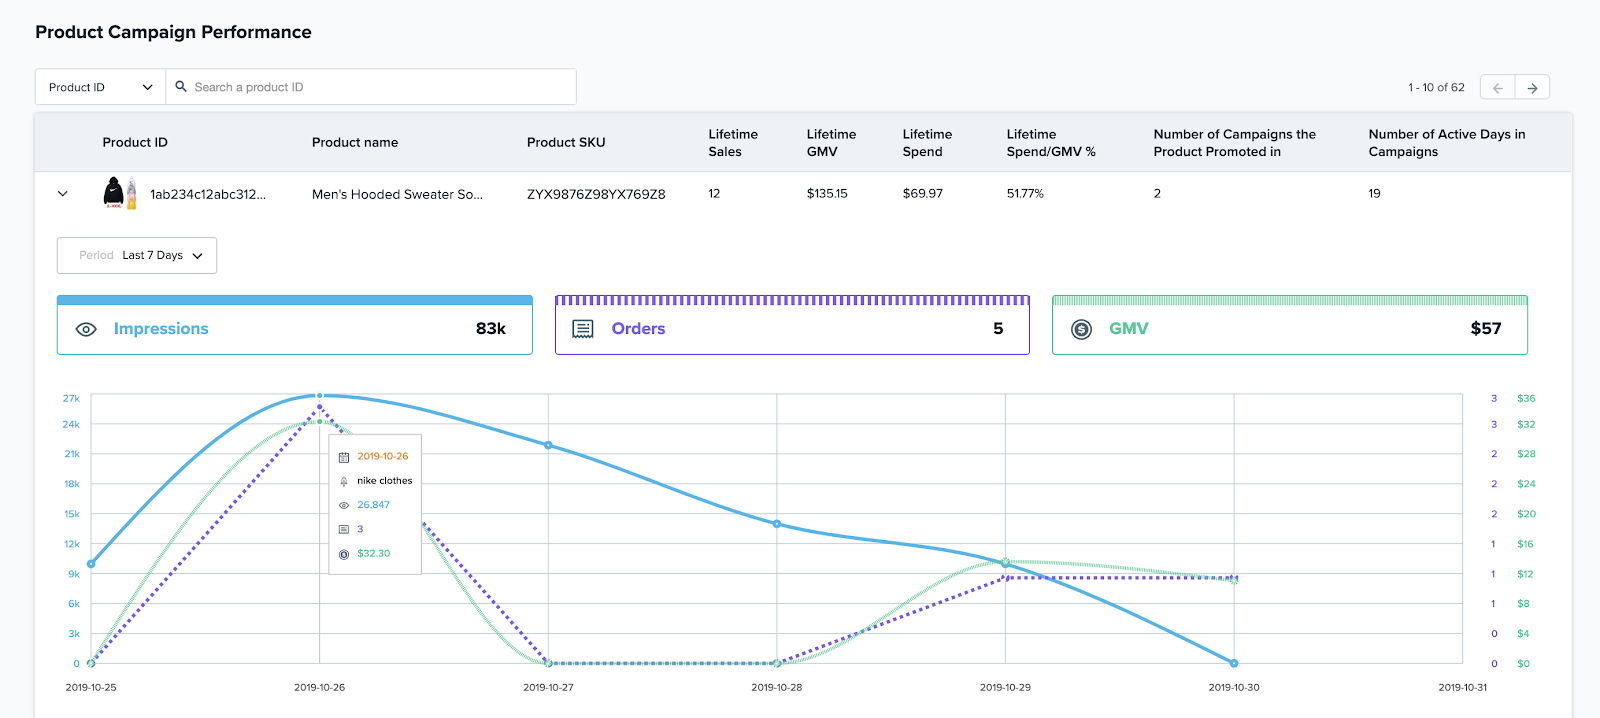
您还可以点击每个产品左侧的下拉菜单,查看其在不同ProductBoost活动中的详情。下图直观地展示了在ProductBoost活动期间产品的销售趋势,可据此更好地评估其表现。在图表的上方,您可选择查看特定时间段内的浏览数、订单和成交总额(如下图所示)。
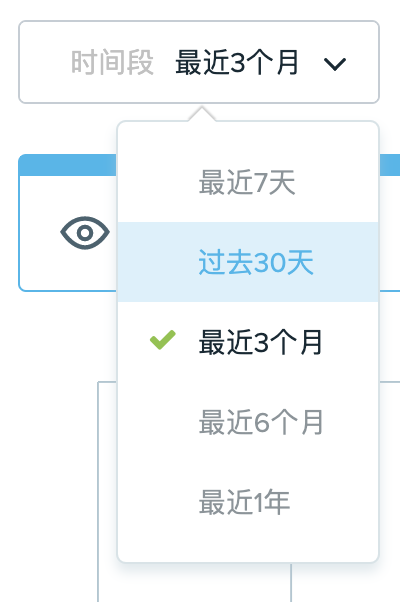
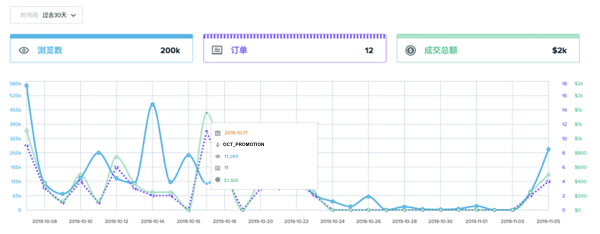
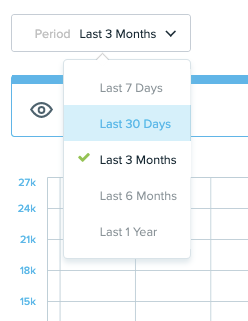
您可通过图表左上角的下拉菜单更改趋势的时间段,可选择最近7天、过去30天、最近3个月、最近6个月或最近年。
此外,如果一个产品在多个非同时进行的ProductBoost活动中进行了推广,那么此图表将仅显示这些不同推广活动活跃阶段的数据信息。
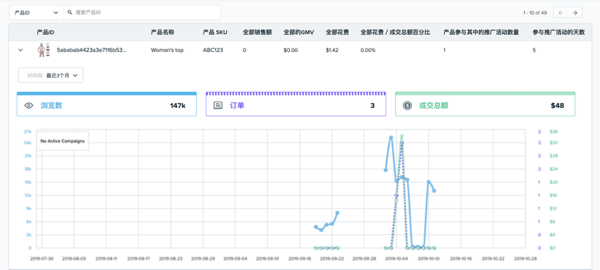
您还可在图表中查看产品的每日分析,将鼠标悬停在图表上您感兴趣的日期线上,将有弹窗显示相关的关键词、当天浏览数、当天订单和当天销售额。
wish商户官网原文详情:
How to Navigate the ProductBoost Product Campaign Performance Page?
Merchants have the ability to view more in-depth insights regarding the products that you have promoted in ProductBoost campaigns on the Product Campaign Performance page within the ProductBoost section of their Merchant Dashboard. These insights and analytics will help to better assess each Product ID’s performance over the course of various ProductBoost campaigns. Take advantage of the metrics on this page to make better educated decisions on how to continue growing your ProductBoost campaigns.
To view ProductBoost performance insights on individual products across different campaigns, on the Merchant Dashboard navigate to ProductBoost > Product Campaign Performance.
On this Product Campaign Performance page you can view the following information regarding your ProductBoost Product IDs: Lifetime Sales, Lifetime GMV, Lifetime Spend, Lifetime Spend divided by GMV, Number of Campaigns the Product Promoted in, and Number of Active Days in Campaign.
Please note, Lifetime is defined as the Product ID’s time in active ProductBoost campaigns.
You can also select the dropdown to the left of each Product ID to view further insights on each individual product throughout the various ProductBoost campaigns in which it has been promoted. The graph visually displays trends to better assess each product’s performance over the course of ProductBoost campaigns. Above the graph, you can view the impressions, orders and GMV for each Product ID across a specified period of time.
For each product, you can change the time period displayed in the graph via the dropdown on the upper left corner of the graph. You may select the following: Last 7 Days, Last 30 Days, Last 3 Months, Last 6 Months, or Last Year.
Additionally, if one product has been promoted in multiple non-concurrent ProductBoost campaigns, the graph will display statistics only across the dates each of these campaigns was active.
You can also view the daily insights for each product in the graph. If you hover over the lines on the graph along the date you are interested in, the popup will display the keywords associated, the daily impressions, daily orders and daily GMV.
文章内容来源:wish商户官方网站