Shopee虾皮卖家如何查看店铺表现指标?
在指标下查看效果
在“帐户运行状况”页上,“指标”部分概述了用于衡量绩效目标的四个类别:
列出违规行为
履行
客户服务
消费者满意度
一目了然,您将能够根据每个指标旁边的图标来确定自己在每个类别中的表现。
绿色的“竖起大拇指”图标表示您已经达到该类别下的所有性能目标,而红色的“感叹号”图标则表明您没有达到该类别下的至少一个性能目标。

了解每个指标
有各种指标可用来衡量每个类别中的绩效目标。
要了解有关每个指标的更多信息,请将光标置于“?”上 图标旁边。弹出窗口将显示指标的定义以及有关如何提高性能的提示。

分析每个指标的效果
您可以使用为每个指标提供的数据来评估您的效果随着时间的推移:
在我的店铺栏显示你的店的当前性能。
“目标”列显示您的效果目标。
“上一周期”列显示您在上一评估周期中的表现。每个评估周期的期间因指标而异。
在点球点列显示获得的任何罚分。
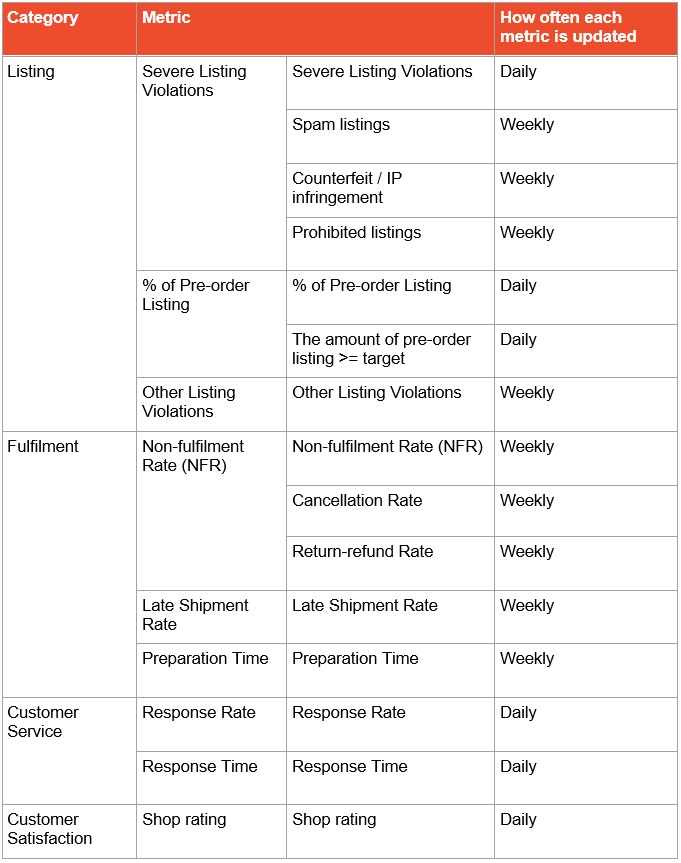
每个评估周期中每个指标的数据都会更新。下表显示了每个指标的更新频率:
访问详细页面以获取指标
如果您未能达到任何指标的性能目标,则可以使用“查看详细信息”功能找到更多信息。
在一个典型的详细页面中,您将看到以下内容:
1. 我的商店:您在本周和过去一周的指标效果以及应达到的目标
2. 罚分:该指标产生的总罚分
3. 键入分布/趋势图(用于选定指标):
一种。饼状图,显示度量标准的计量单位分布(例如,在严重列表违规下,您将看到三种违规类型的分布)
b。趋势图显示度量随时间变化的性能,可以针对所选度量进一步过滤该趋势图
4. 持续时间下拉菜单:过滤您看到的数据周或日基础
5.根据度量标准,您可能会看到与该度量标准相关的相关列表(例如,严重违规)或影响订单(例如,不履行率)的列表。
6.您可以选择查看详细信息以获取有关每个清单或订单的更多信息。
shopee官网原文详情:
Reviewing performance under Metrics
On the Account Health page, the Metrics section provides an overview of four categories used to measure your performance targets:
Listing Violations
Fulfilment
Customer Service
Customer Satisfaction
At a glance, you'll be able to identify how well you are doing in each category based on the icon beside each metric.
A green 'thumbs up' icon indicates that you've met all performance targets under the category, while a red 'exclamation mark' icon suggests that you've failed to meet at least one performance target under the category.
Understanding each metric
There are various metrics used to measure your performance targets in each category.
To learn more about each metric, place your cursor over the '?' icon beside it. A pop-up will show you the definition of the metric and tips on how to improve your performance.
Analysing your performance for each metric
You can assess your performance over time using the data provided for each metric:
The My Shop column shows your shop's current performance.
The Target column shows your performance target.
The Previous Cycle column shows your performance in the previous assessment cycle. The period of each assessment cycle varies across different metrics.
The Penalty Points column shows any penalty points gained.
The data of each metric is updated in every assessment cycle. The following table shows how frequently each metric is updated:
Accessing detailed pages for metrics
In the event where you failed to meet the performance targets for any metric, you'll be able to find out more using the View Details function.
In a typical detailed page, you'll see the following:
1. My Shop: your performance for the metric in the current and past week, as well as the target you should be meeting
2. Penalty Points: total penalty points incurred for the metric
3. Type Distribution/Trend Charts (for selected metrics):
a. A pie chart showing the distribution of the units of measurement for the metric (e.g. under Severe Listing Violations, you’ll see the distribution of the three types of violations)
b. A trend chart showing the performance of the metric over time, which can be further filtered for selected metrics
4. Duration dropdown menu: to filter the data you see by Week or Day basis
5. Depending on the metric, you may see a list of Related Listings (e.g. for Severe Listing Violations) or Impact Orders (e.g. for Non-fulfilment Rate) that are associated with the metric.
6. You can select View Details for more information on each listing or order.
在指標下查看效果
在“帳戶運行狀況”頁上,“指標”部分概述了用於衡量績效目標的四個類別:
列出違規行為
履行
客戶服務
消費者滿意度
一目了然,您將能夠根據每個指標旁邊的圖標來確定自己在每個類別中的表現。
綠色的“豎起大拇指”圖標表示您已經達到該類別下的所有性能目標,而紅色的“感嘆號”圖標則表明您沒有達到該類別下的至少一個性能目標。
了解每個指標
有各種指標可用來衡量每個類別中的績效目標。
要了解有關每個指標的更多信息,請將光標置於“?”上 圖標旁邊。彈出窗口將顯示指標的定義以及有關如何提高性能的提示。
分析每個指標的效果
您可以使用為每個指標提供的數據來評估您的效果隨著時間的推移:
在我的店鋪欄顯示你的店的當前性能。
“目標”列顯示您的效果目標。
“上一周期”列顯示您在上一評估週期中的表現。每個評估週期的期間因指標而異。
在點球點列顯示獲得的任何罰分。
每個評估週期中每個指標的數據都會更新。下表顯示了每個指標的更新頻率:
訪問詳細頁面以獲取指標
如果您未能達到任何指標的性能目標,則可以使用“查看詳細信息”功能找到更多信息。
在一個典型的詳細頁面中,您將看到以下內容:
1. 我的商店:您在本周和過去一周的指標效果以及應達到的目標
2. 罰分:該指標產生的總罰分
3. 鍵入分佈/趨勢圖(用於選定指標):
一種。餅狀圖,顯示度量標準的計量單位分佈(例如,在“嚴重列表違規”下,您將看到三種違規類型的分佈)
b。趨勢圖顯示度量隨時間變化的性能,可以針對所選度量進一步過濾該趨勢圖
4. 持續時間下拉菜單:過濾您看到的數據週或日基礎
5.根據度量標準,您可能會看到與該度量標準相關的相關列表(例如,嚴重違規)或影響訂單(例如,不履行率)的列表。
6.您可以選擇查看詳細信息以獲取有關每個清單或訂單的更多信息。
文章来源:shopee官方网站